Historical Data on the Distribution of Lovelocks in England and Wales |
Where did the Lovelocks originate? Follow this link to explore the possibilities in early County records.
The following tables, maps and charts show the distribution of Lovelocks/Lovelucks from the census returns for 1841 to 1921, together with some pointers towards further information concerning the distribution of Lovelocks.
Raw Data
The table on this page illustrates the number of Lovelock entries by County for each census from 1841 to 1921, according to census place (for the 1881 census, figures are also available by place of birth, but these are not included in the table), together with data from the 1939 Register. English and Welsh counties are grouped separately. The data for all except the 1881 census was derived from figures provided by Graham Lovelock, with the addition of data for LovelUcks for the 1901 census. The totals for England and the grand totals for England and Wales are also displayed, together with the percentage increase of these numbers for each year over the preceding year. Most of the raw data (except for 1881) was obtained from the Ancestry and Find my Past Web Sites, and comparison with other sources for some Counties shows that the figures are not completely accurate for a variety of reasons. Nevertheless, they should be sufficient to show the relative numbers for different Counties, and the trend over the years.Maps
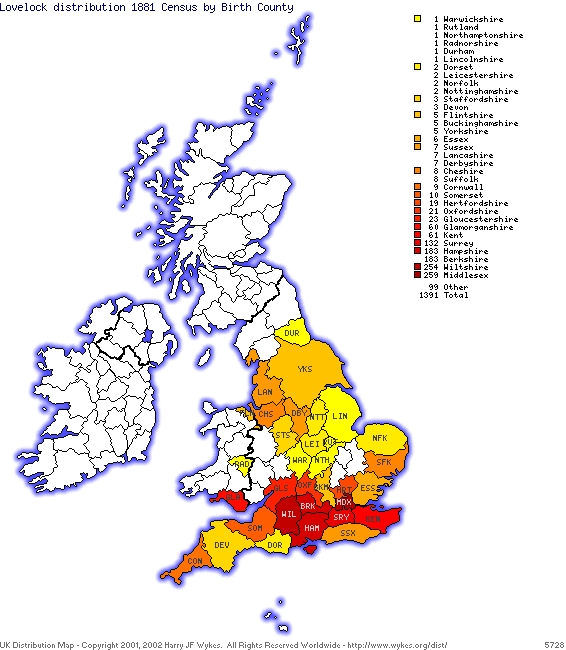
Some of the data is also presented in the form of a sequence of maps of the distribution of Lovelocks (best viewed in full screen mode!) according to Census County for the 1841, 1881 and 1901 censuses only. The three-letter abbreviations shown on this map are the well-known Chapman County Codes.
Note: These maps were derived from that prepared by Riley Williams (rhw@memalpha.cx) and displayed on the GENUKI Web pages. They are used here with permission from Riley Williams. Here is the copyright notice which accompanies the original version.
There are a number of tools available on the Web for producing maps showing the
distribution of a particular surname in different censuses. The results are presented in various
formats which prevents a direct comparison with the maps above. These include the following:
1. A tool which automatically produces such maps for the 1881 census only. Using this tool, James produced the following maps:
Distribution of Lovelocks in the 1881 census according to census place
Distribution of Lovelocks in the 1881 census according to birth place
Population density of Lovelocks in the 1881 census by birthplace
2. The distribution of Lovelock families at the 1891 census is available on the Ancestry Web site. The total number of Lovelocks in the 1891 census was 1452 (figure courtesy of Graham Lovelock), only slightly higher than the figure of 1391 for 1881 (see above).
Charts
The first chart compares the distribution by county for the 1841 to 1901 censuses for English counties, whereas the second chart presents the distribution for Welsh counties.Finally, courtesy of Graham Lovelock, there is a chart showing the age distribution for male and female Lovelocks from the 1901 UK census (blue for the former and pink for the latter, of course!).